Rich HTML5 Charts everywhere with DevExtreme
The rapid rise of mobile devices has created new opportunities for software developers: applications available anywhere and at any time, but has brought with it new problems: do I need to make a website and then a separate mobile application for every platform?
While iOS, Andriod and Windows Phone all use different programming languages, frameworks and tools for native apps, what is cross-platform between every device is HTML and JavaScript. Not only will an HTML5 mobile application allow us to target every platform, we can also reuse skills and knowledge from traditional website development.
In this blog post I will look at DevExtreme, a cross-platform HTML JS framework for Visual Studio, and in particular DevExtreme’s rich JavaScript charting widgets.
Installation and first impressions
DevExtreme has a great looking custom installer that is impressively simple and easy to use: choose trial installation, customize that install location if you want and you’re done.


After installation is complete you are presented with a dialog that serves as a hub to developers getting started with DevExtreme. Resources available to you include links a number of online demos, demo source code that was installed with DevExtreme and comprehensive documentation.
The online chart demos in the DevExtreme Data Visualization Gallery are particularly impressive. There are over 50 charts and their source code available which I found a great aid when using DevExtreme.

Getting Started
To try out DevExtreme’s charting widgets I’m going to create a simple cross-platform dashboard for the online game streaming website Twitch. My dashboard app will query Twitch’s REST API for data and graph the games being streamed and the number of viewers over time of the most popular streams.
Although I’m building my dashboard using ASP.NET MVC and Visual Studio, DevExtreme is a JavaScript framework and it can be used with any server side language and IDE.

Reference the DevExtreme CDN
The first step is adding the DevExtreme charting JavaScript file to the website. Fortunately DevExpress provides a CDN that hosts the JavaScript file we need.
<script type="text/javascript" src="http://cdn3.devexpress.com/jslib/13.1.5/js/dx.chartjs.js"></script>
The CDN returns a compressed, cached response to keep the website nice and fast.
Creating a Chart
DevExtreme’s data visualization widgets include line, bar, area and pie charts; circular and linear gauges; and range selectors. On the dashboard homepage I will create a pie chart displaying the most popular games being streamed on Twitch.
$("#gamesChartContainer").dxPieChart({
dataSource: [
{
game: "Test game 1",
viewers: 50,
channels: 1,
image: "test-game-1.jpg"
},
{
game: "Test game 1",
viewers: 50,
channels: 1,
image: "test-game-1.jpg"
}
],
series: [
{
argumentField: "game",
valueField: "viewers",
label: {
visible: true,
connector: {
visible: true,
width: 1
}
}
}
]
});
Call dxPieChart on the element you want the chart to appear in. Options are passed to the chart using a simple JSON object as an argument.
Fetching Data from Twitch.tv
Right now the pie chart is displaying static data. To bring in some real world data we’ll call Twitch.tv’s REST API. Because their API supports JSONP we can call the services directly from JavaScript using jQuery.
var ds = [];
$.getJSON("https://api.twitch.tv/kraken/games/top?callback=?", function (json) {
for (var i = 0; i < json.top.length; i++) {
ds.push({
game: json.top[i].game.name,
viewers: json.top[i].viewers,
channels: json.top[i].channels,
image: json.top[i].game.box.large
});
}
});
Once you have your data ready just include it in the options when initializing the chart.
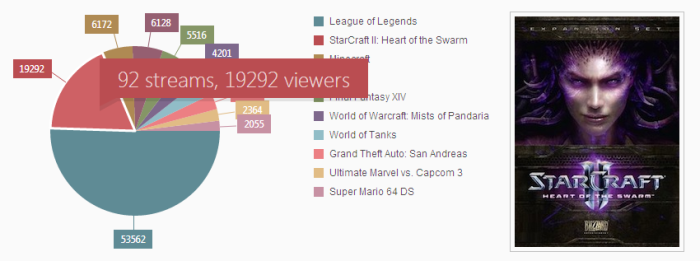
Interactive Chart
The DevExtreme chart widgets have extensive options for hooking into client side events. To add a tooltip and click action to each game in the pie chart just wire up some functions to the tooltip and pointClick properties when initializing the chart.
tooltip: {
enabled: true,
customizeText: function () {
var game = ds[this.point.index];
return game.channels + ' streams, ' + game.viewers + ' viewers';
}
},
pointClick: function (p) {
var game = ds[p.index];
$("#gameContainer").html("<img class='game-image' src='" + game.image + "'/>");
},
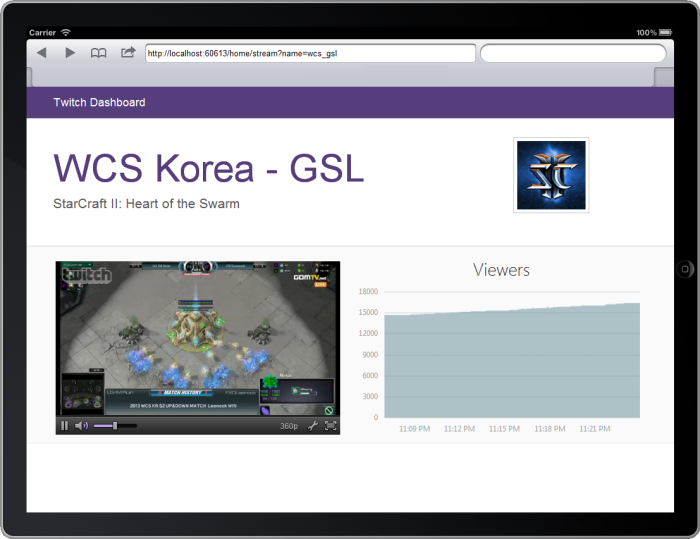
Creating a Dynamically Updating Chart
The second chart we’ll create for the dashboard application is an area graph over viewers over time for a video game stream. The chart will start out without any data but every couple of seconds we’ll call a Twitch API to return the viewer count and dynamically update the graph with the new data.
$("#streamChartContainer").dxChart({
title: "Viewers",
commonSeriesSettings: {
type: "splineArea",
argumentField: "date"
},
series: [
{ valueField: "viewers", name: "Viewers" }
],
argumentAxis: { valueMarginsEnabled: false },
legend: { visible: false },
animation: { enabled: false }
});
Note that no data source has be included in the code above. Data will be retrieved from the Twitch API and set against the chart dynamically.
var dataSource = [];
function getStreamData() {
$.getJSON("https://api.twitch.tv/kraken/streams/" + name + "?callback=?", function (json) {
var viewers = json.stream.viewers;
dataSource.push({
date: new Date(),
viewers: viewers
});
$('#streamChartContainer').dxChart('option', 'dataSource', dataSource);
});
}
setInterval(function () {
getStreamData();
}, 5000);
Every 5 seconds the browser will poll the server for the current viewers, add the count and date to the data collection and then update the chart with the data collection as an argument.

Wrapping Up
I found the chart widgets in DevExtreme to be fast to setup and easy to use while still offering a lot of power for customization.
My small application has barely scratched the surface here of what the chart widgets offer, let alone the other features included in DevExtreme. If you’re looking to building a cross-platform multi-device application then DevExtreme is definitely worth a look.
Click here to download the Twitch Dashboard application source code
Disclosure of Material Connection: I received one or more of the products or services mentioned above for free in the hope that I would mention it on my blog. Regardless, I only recommend products or services I use personally and believe my readers will enjoy. I am disclosing this in accordance with the Federal Trade Commission’s 16 CFR, Part 255: Guides Concerning the Use of Endorsements and Testimonials in Advertising.